Coherent Doppler lidar measurements are of increasing interest for the wind energy industry. Wind measurements are fundamental inputs for the evaluation of potential energy yield and performance of wind farms. Three-dimensional scanning Doppler lidar may provide a new basis for wind farm site selection, design, and optimization. 3-D coherent Doppler lidar is capable of calculating (Krishnamurthy et al. 2011)
-
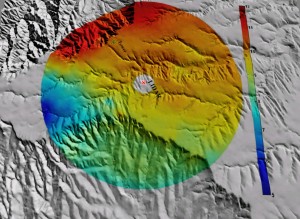
Spatial variation of wind field
 Figure 1. Terrain-following wind speed at hub height (80 m).
-
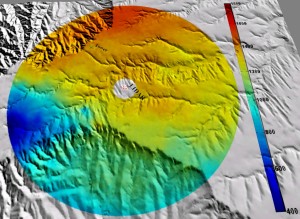
Spatial power density estimates
 Figure 2. Terrain-following wind power at hub height (80 m).
-
Spatial wind speed distribution
 Figure 3. Spatial Wind Distributions at various location on the domain.
-
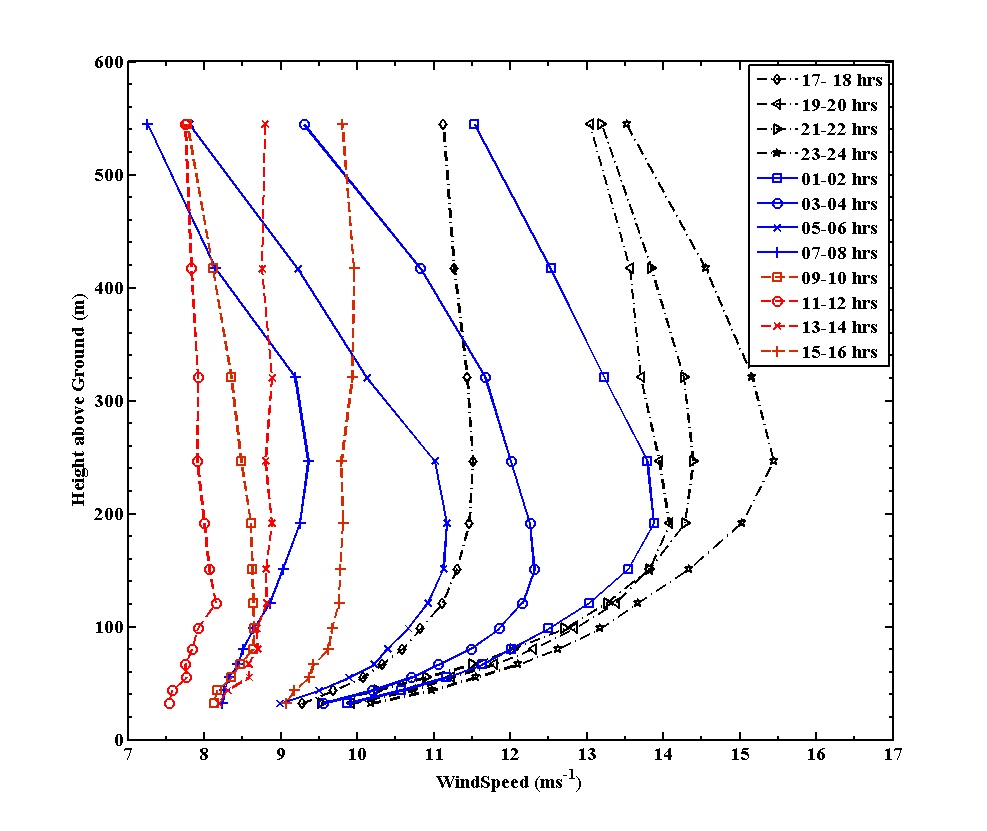
Vertical Profiles of Wind speed
 Figure 4: Two hour averaged vertical profiles from lidar, showing high shear observed within the rotor swept region.
-
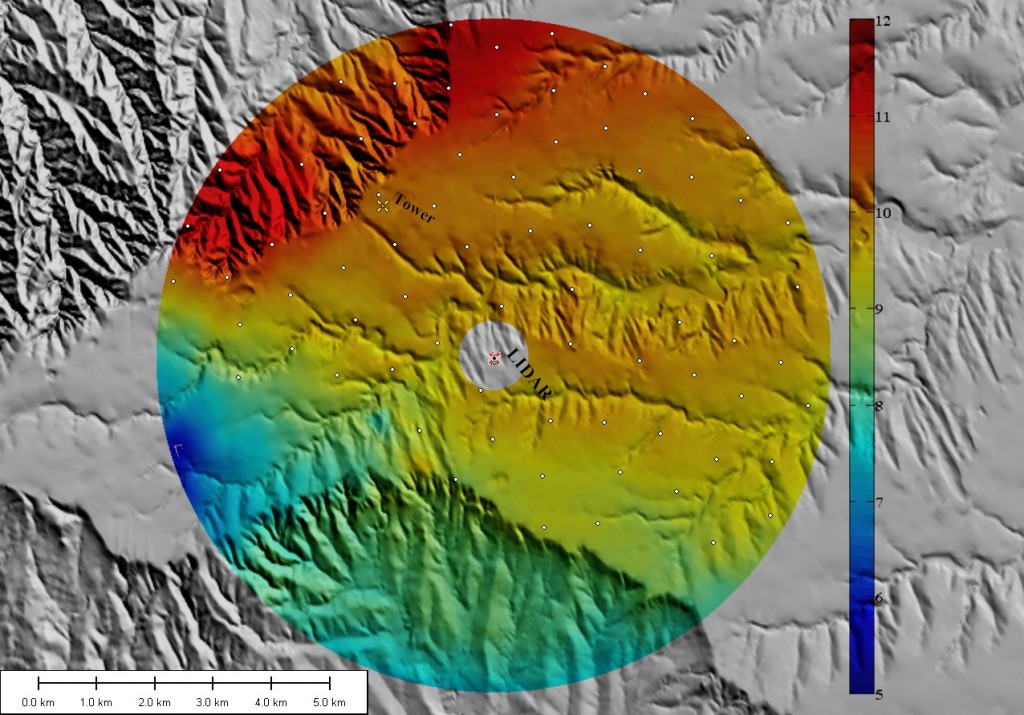
Wind Turbine Siting
 Figure 5. Optimal locations of wind turbines (75) overlaid over averaged wind map. The white circular dots represent locations of wind turbines based on the algorithm. The color bar shows wind speed in ms–1at 80 m hub height.
- Tower Validation
Table 1: Tower – Lidar wind speed statistics over the period of observation
| Instrument | Mean (ms-1) | Standard Deviation (ms-1) | 10 minute RMS Difference (ms-1) |
Tower @ 50 m |
9.67 |
3.60 |
1.18 |
Lidar @ 50 m |
9.61 |
3.61 |
Table 2: Wind Speed RMS difference statistics for various time averaging periods
| Wind speed RMS difference | 10 minute RMS difference (ms-1) | 1 Hour RMS difference (ms-1) | 24 hour RMS difference (ms-1) |
@ 50 m |
1.18 |
0.72 |
0.46 |
Please refer Krishnamurthy et al. 2011 for further details.
